Kathryn Korostoff of Research Rockstar, a research training firm, presented a webinar with Sandy McKee of SurveyGizmo on ensuring that your research is actionable. Many Research Rockstar students are told by their clients to present actionable results. Unfortunately, actionability is very subjective – what some people perceive as actionable, others might not. Here’s a three-step framework for making sure that people perceive your research results as actionable.
Step 1: Speaking the Language of “Business”
Too often we speak “businessese” or “consultingese,” as in this cartoon:
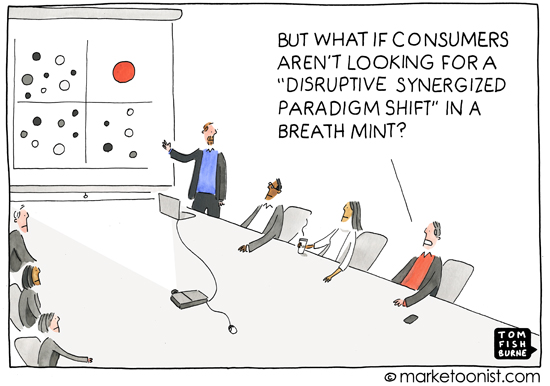
Researchers are used to certain terms and jargon, but marketers and other teams often are unfamiliar with these terms.
Words to Use or Avoid in Research Reports
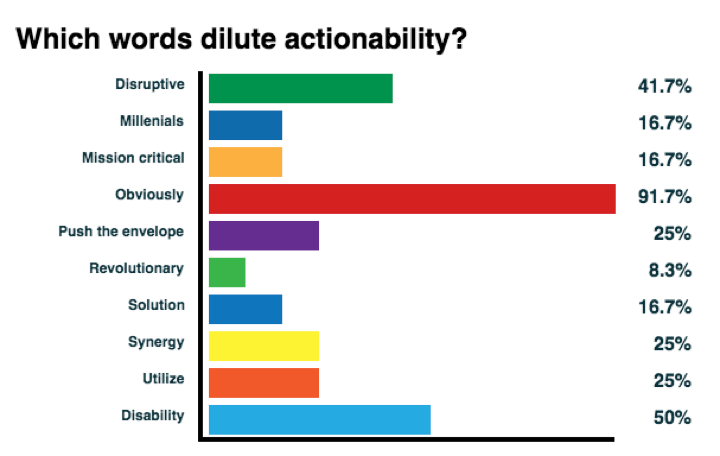
Powerful words that resonate with users of research include action, challenge, competitive advantage, opportunity, options. Include these power words in your management summary! (Also use customer, emerging, improvement, new, precise). Words to avoid include obviously, disability, disruptive and mission critical.
Here’s a poll of webinar attendees:
Here are three sample statements:
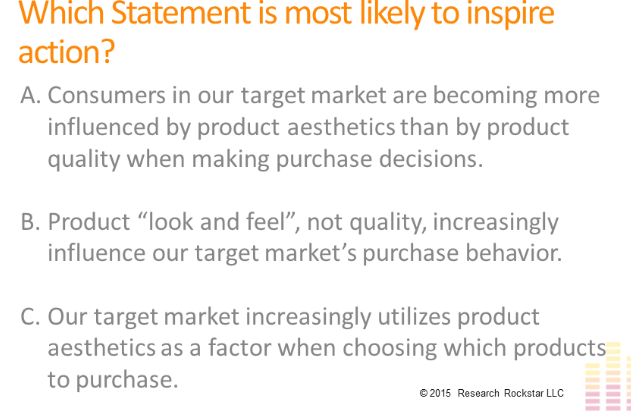
While all three statements say the same thing, B is most representative of actionable feedback. While attendees liked C as much as B, C includes the word utilize, which turns people off (as opposed to use).
People who receive research results value having those results described in a way that is precise. Make certain that your management summary hits these key:
- Does the management summary clearly identify business opportunities? Does it actually use the word opportunity?
- Does the summary clearly identify business challenges?
- Does it convey something that can be clearly and directly implemented? Failing to point out what can be implement was frequent negative feedback in the research that Kathryn has conducted into actionability.
Step 2: Making it Easy for Busy Readers
How busy are today’s business people? They may very well be reading your research report on their smartphones!
Worse, they’re not used to reading research results. Too often, researchers make their analysis more complicated than it needs to be. As one business leader told Kathryn, “I don’t read charts and graphs all day, so the report needs to be intuitive.”
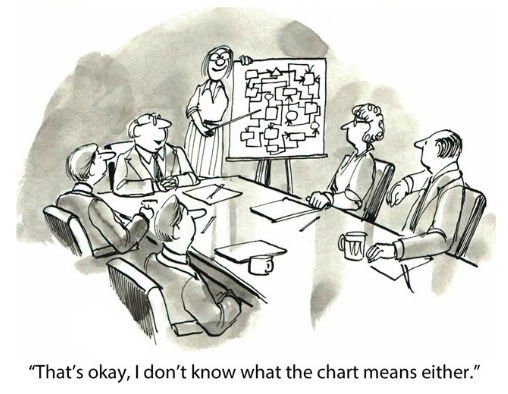
“Too often we see beautiful charts with wonderful colors that do not convey anything,” Sandy added. “The charts are just eye candy.”
Kathryn offered four criteria to facilitate easy reading:
- Use simple language, avoiding unnecessary multisyllabic words. “Simple language shows that the writer is confident,” Kathryn said.
- Support key findings with your data; don’t make the reader have to work hard to understand the path from the data to the conclusions.
- Address contradictory or implausible results up front rather than expecting readers to understand the differences. Be proactive!
- Write lists as bullet points. Use parallel construction, like this list does! “People love bullet points!”
Step 3: Moving Beyond Single Data Points
Many non-researchers feel that the best research synthesizes multiple data points to pull together the key takeaways. Therefore, rather than opening up your report with a lot of pie charts, use frameworks to synthesize your survey results in a way that your reader will find comfortable. “Categorization is the first step to analysis!” Kathryn said. “Mapping the data points simply by categorizing the data makes it more useful.”
Some common frameworks you can utilize use:
You can use these frameworks to explore the data. You might not publish those frameworks that aren’t particularly useful. “I’ve done projects where I’ve looked at 8 to 10 perceptual maps before deciding which one to use with the client,” Kathryn said. Use visualization for data exploration.
Business users of research told Kathryn “If I see a pattern in the data and it wasn’t pointed out to me, I feel like I’m doing the work. The researcher has to show me the recurring patterns.”
Triangulation
But don’t just use these frameworks on data from your own survey. Triangulate! Integrate precise references to similar results from other studies or secondary data. “We are often reporting the results from a survey,” Kathryn said, “but business decision makers want more than one data point. Can you give me more to demonstrate that it is not just an anomaly?” If users are skeptical of survey results, they need more data points – by showing them other data points.
Take the Food and Drug Administration as an example. The FDA does multiple studies before approving a drug. Their last report said they require 8 separate studies before making a decision. “Now our surveys aren’t resulting in life and death decisions! But companies make vital decisions – investing in a new ad campaign, a new sales channel, a new factory. While these decisions are not life and death, they do need to be supported by more than one data point.”
Keeping true to the triangulation angle, Sandy asked if 3 data points were acceptable. “It depends,” said Kathryn. “I know delivering survey research where the results are controversial or hard to believe, you need more data points than other studies. For instance, we had a client who wanted to add a feature they could charge a premium for, but the survey research showed that would be risky, as not that many people valued that feature for that premium. I knew the client would be unhappy, so I was extra vigilant about providing relevant additional data points.”
Four sites to check out are pewresearch.org, gallup.com, census.gov, and marketresearch.com. “I literally had a client who was in the road paving business, who made the equipment that people use to pave roads. They wanted to survey municipalities, but I had never done that type of work. I went on marketresearch.com and found a report I could purchase discuss trends in road paving!” Kathryn add, “It is not as time consuming as it sounds to triangulate. It’s worthwhile – especially if the survey reveals bad news. They might say, ‘You surveyed the wrong people, your questions were confusing.’ If it reveals good news, people don’t question it as much!” Kathryn said.
Conclusion
By following these three steps, researchers maximizes the chances of delivering reports that will be actionable. Speaking the client’s language, making it easy for them to read, and moving beyond single data points are all requirements for turning your data into decisionmaking gold.
Want to learn more about actionability? Download this Actionability Assessment. If you didn’t answer “Yes” to at least three of the last 6 questions, chances are your market research report and management summary are heavy on data and light on actionable insights!
Author Notes:
Jeffrey Henning
